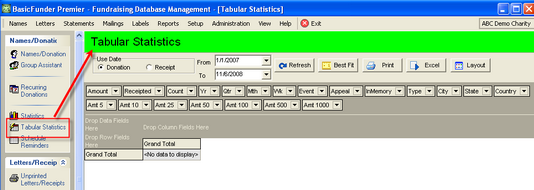
Tabular Statistics provides an easy facility to assist you in seeing your data from different points of view. Tabular Statistics is found on the Names/Donation Menu.
Step 1.
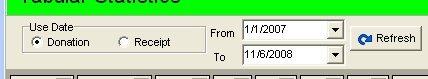
The first step to using Tabular Statistics is to select the data you want to analyse.
Choose Donation Date or Receipt Date, Select From and To Date Range and Click Refresh.
Step 2.
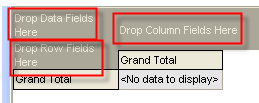
We need to Drag Fields into one of three Areas:
•Drop Data Fields Here
•Drop Row Fields Here
•Drop Column Fields Here
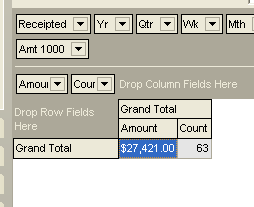
Drop Data Fields Here
I have dropped the Amount and Count Fields from the top list of data fields, into the "Drop Data Fields Here" area. Almost instantly, the Amount and Count are calculated based on the data we selected in Step 1.
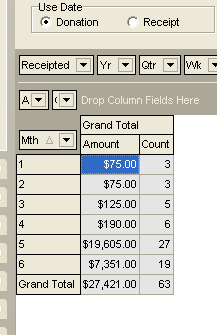
Drop Row Fields Here
Now Drag the Mth (month) Field into the Drop Row Fields Here... we now have the break down of our data by month again based on the data we selected in Step 1.
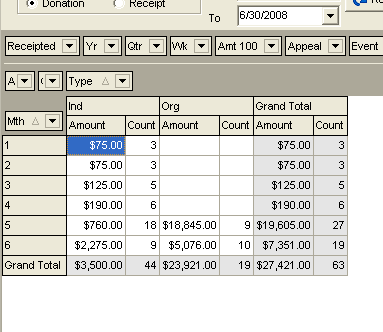
Drop Column Field Here
Now Drag the Type Field into the Drop Column Fields Here... we break down our data by Organization and Individual....
You can go back to Step one and select different date ranges and the Statistics will change also.
Step 3.
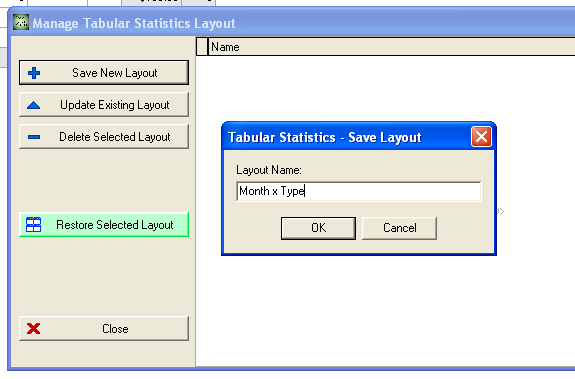
Click the Layout button to Save the Statistical Layout you have created for reuse later. Click the Save New Layout and give the Layout a Name. Next time you use Tabular Statistics, you just need to select the Date Range and Refresh - then Click the Layout button, highlight your previously stored layout and click Restore Selected Layout.